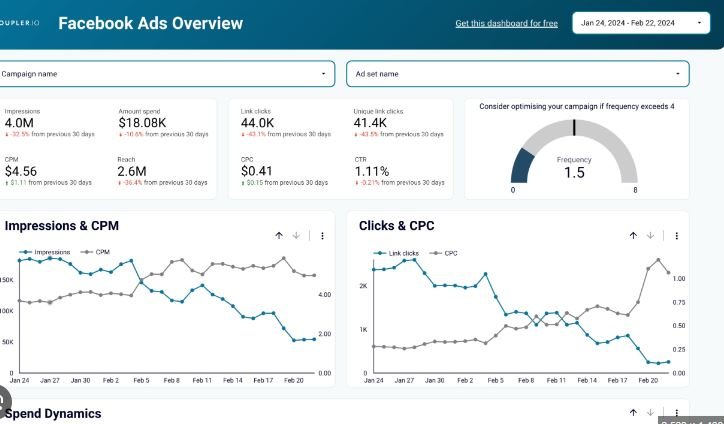
Analyzing Facebook ad performance requires understanding key metrics and applying strategies that improve your campaigns. Successful ad campaigns on Facebook depend not only on creative design but also on how well you monitor and optimize performance. By focusing on specific metrics, you can make data-driven decisions that lead to better results.

Identify Key Performance Indicators (KPIs)
Before analyzing your ad performance, it’s essential to identify your key performance indicators (KPIs). These KPIs reflect your campaign goals, whether it’s brand awareness, engagement, or conversions. For instance, if your goal is to drive traffic to your website, tracking link clicks and click-through rates (CTR) would be crucial. By clearly defining your KPIs, you establish benchmarks to measure your ad’s success.
Track Click-Through Rates (CTR)
Click-through rate (CTR) is one of the most important metrics when analyzing Facebook ad performance. It shows the percentage of people who clicked on your ad after seeing it. A high CTR indicates that your ad is resonating with your audience, while a low CTR suggests that changes may be needed. For example, if you notice a low CTR, consider adjusting your ad copy or visuals to make it more engaging.
Monitor Conversion Rates
If your campaign goal is conversions, such as sales or sign-ups, tracking your conversion rate is vital. This metric tells you the percentage of users who completed the desired action after clicking on your ad. To improve conversion rates, make sure your landing page aligns with your ad’s message and provides a seamless user experience. For instance, ensuring your landing page loads quickly and includes a clear call-to-action can boost conversions.
Evaluate Cost-Per-Click (CPC)
Cost-per-click (CPC) measures how much you pay for each click on your ad. This metric helps you determine whether your ad spending is efficient. A high CPC could indicate that your targeting needs refinement, or that your ad isn’t resonating with your audience. For example, by narrowing your audience to more relevant users, you can potentially lower your CPC and improve overall performance.
Analyze Return on Ad Spend (ROAS)
Return on ad spend (ROAS) measures the revenue generated for every dollar spent on your Facebook ads. This metric provides insight into the profitability of your campaign. For example, if you’re spending $1,000 on ads and generating $5,000 in revenue, your ROAS would be 5:1. By continuously optimizing your ad creatives and targeting, you can maximize your ROAS and drive more value from your campaigns.
Examine Audience Engagement
Audience engagement metrics, such as likes, shares, and comments, offer insight into how your ad resonates with your target audience. High engagement suggests that your content is appealing, while low engagement may require adjustments. For example, if your ad receives many likes and shares but few conversions, you might need to refine your call-to-action to guide users toward your goal more effectively.
Consider Ad Frequency
Ad frequency refers to how often the same user sees your ad. While repeated exposure can increase brand awareness, showing the same ad too frequently can lead to ad fatigue, where users become less likely to engage. Monitoring your ad frequency helps you strike the right balance. For instance, if you notice that your frequency is high but engagement is dropping, it might be time to refresh your ad creatives to keep your audience interested.
Optimize for Ad Placement
Facebook offers various ad placements, such as News Feed, Stories, and Messenger, each offering unique benefits. Analyzing which placements deliver the best performance can help you allocate your budget more effectively. For example, if your ads perform better in Stories than in the News Feed, you can shift more of your budget to that placement. Regularly reviewing placement data allows you to optimize your campaigns for better results.
Use A/B Testing to Improve Performance
A/B testing, also known as split testing, allows you to compare two versions of an ad to determine which one performs better. By testing different elements, such as headlines, images, or CTAs, you can identify what resonates most with your audience. For example, you could test two different headlines to see which one generates more clicks, then optimize your future ads based on the results.
Conclusion
Analyzing Facebook ad performance involves tracking key metrics, such as CTR, conversion rates, CPC, ROAS, engagement, and ad frequency. By focusing on these metrics, you can make informed decisions that enhance your campaigns. Regularly evaluating your ad placements, conducting A/B testing, and optimizing based on performance data will lead to more effective Facebook ads. Use these strategies to continuously improve your Facebook ad performance and achieve your campaign goals.


